Documentation
Grafana
Grafana and Leankoala play along very well. It is possible to visualize all metrics Leankoala is collecting as Grafana graphs. Only three steps are needed to create a new dashboard.
Install the Simple JSON Datasource provided by Grafana.
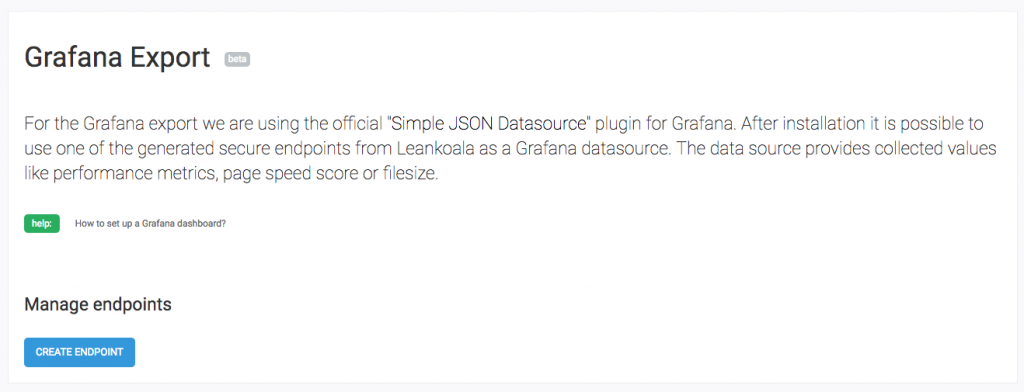
Create a new Leankoala endpoint for the export (Grafana Admin)
Switch to your Grafana installation and create a new data source. This can be done via „Configuration > Data Sources“. There you just click on „+ Add data source“.
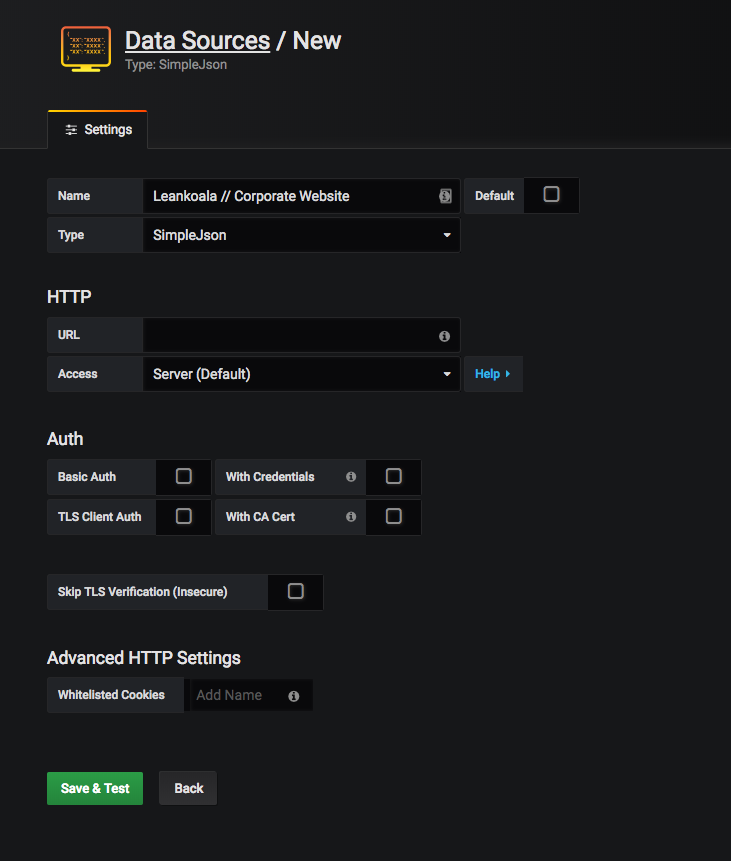
On the „Data Sources / New“ form you only have to fill in three fields. The name of the data source. We recommend to let it start with Leankoala but you can choose whatever you want. The type must be SimleJson. As URL you enter the previously generated Leankoala endpoint. The only thing that needs now to be done is „Save & Test“. From now on you are able to select Leankoala as a data source when you are creating a new dashboard and graph.
As the Grafana JSON format does not support a unit we provide a list of data units in this documentation.